
Fraud Radar
See where fraud occurs in your applicant flow and identify the applicants behind it.
Fraud Radar is a Dashboard page that brings your fraud results together in one place. It shows how many applicants you reject for fraud and how this number changes over time, which applicant groups have more fraud than others, and examples of individual applicants and fraud networks.
Fraud Radar helps you answer three questions:
- What happens — how the number of fraud cases and applicant risk levels change over time.
- Where it happens — which countries, document types, platforms, and other groups have more fraud.
- Who is behind it — which applicants and fraud networks are connected to the problem.
Use Fraud Radar to:
- Get the full picture before you review individual applicants.
- Identify the applicant groups that need more attention and decide where your team starts its review.
- Go from a number on a chart to the list of applicants behind it, without exporting data or building your own reports.
- Make sure that your applicant risk levels match confirmed fraud before you use them for automated decisions.
Fraud Radar uses data that Sumsub already collects during applicant checks. You do not need to do any technical setup.

Prerequisites
Fraud Radar is available to all clients. The page sections you see depend on the Sumsub services you use and the permissions of your Dashboard user role.
| Page section | Requirements |
|---|---|
| Fraud Radar page | Permissions: View statistics and analytics, View applicants, View list of applicants. |
| Risk levels | Services: Applicant risk scoring with risk levels, for example, from Fraud Prevention Starter Kit. |
| Applicants examples | Permissions: View applicant’s personal data. |
| Largest applicants networks examples | Services: Fraud Network Detection. Permissions: View fraud networks. |
Get started with Fraud Radar
In the Dashboard, go to Monitoring → Fraud radar.
Use the filters at the top of the page to select a period and the applicants you want to analyze. All page sections use the same filters. For example, if you select one country, all charts, tables, and examples show only applicants from that country.
| Filter | Shows applicants |
|---|---|
| Created | Created in the selected period. |
| Reject label | Rejected with the selected rejection labels. You can show applicants with any of the selected labels or with all of them. |
| Risk level | With the selected risk levels. |
| Risk label | With the selected risk labels. |
| ID document country | With an ID document issued by the selected countries. |
| Document type | With the selected ID document types, for example, a passport. |
| IP country | Who connected from the selected countries, based on their IP address. |
| Level | Who went through the selected verification levels. |
| Source key | With the selected source keys. |
| Tag | With the selected tags. You can show applicants with any of the selected tags or with all of them. |
| Platform | Who used the selected platform: API, Web, Android, or iOS. |
TipThe page link keeps your filters. To show the same data to your colleague, share the link with them.
Fraud Radar metrics
Fraud Radar counts only reviewed applicants. Each applicant is counted once, based on the latest review decision.
NoteRates are calculated as the number of applicants in a group divided by the number of reviewed applicants.
| Metric | Description |
|---|---|
| Reviewed applicants | Applicants created in the selected period whose review is completed. |
| Rejected for fraud | Reviewed applicants rejected with one of the fraud rejection labels. |
| Fraud rate | Share of reviewed applicants rejected for fraud. |
| Rejected for high-risk profile | Reviewed applicants rejected with the High risk rejection label. |
| High-risk profile rate | Share of reviewed applicants rejected for high-risk profile. |
Fraud Radar treats the following rejection labels as fraud:
- Forgery
- Fraudulent liveness
- Fraudulent Patterns
- Selfie mismatch
- Bad face matching
- Blocklist
- Suspected stolen documents
- Third party involvement
NoteOne applicant can be counted in both rates. For example, an applicant rejected with the Fraudulent Patterns and High risk labels counts as rejected for fraud and as rejected for high-risk profile. Do not add the two rates together.
Fraud Radar sections
The page moves from the general picture to individual applicants: totals and trends first, then applicant groups, then examples of applicants and fraud networks.
Reviewed applicants
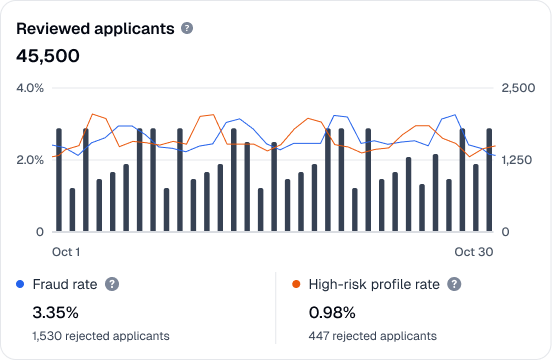
The Reviewed applicants chart shows the number of reviewed applicants and how the Fraud rate and High-risk profile rate change over the selected period.
- Bars show the number of reviewed applicants, measured on the right scale, Applicants.
- Lines show the two rates, measured on the left scale, Rate.
Totals for the full period are displayed above the chart.
Risk levels
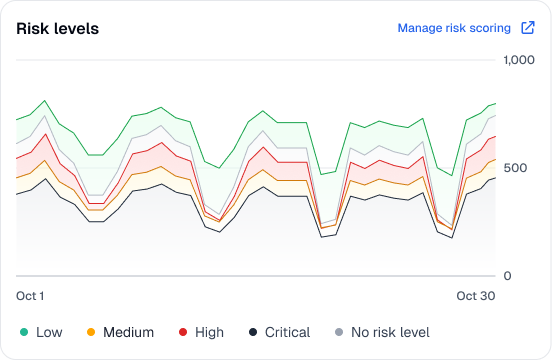
The Risk levels chart shows how many applicants received each risk level in the selected period. Level names and colors match your applicant risk scoring settings. Applicants without a risk level are grouped under (no risk level).
Use this chart to track increases in high-risk applicants and to check that levels are distributed as you expect. To change how Sumsub assigns risk levels, select Manage risk scoring.
If you have no risk levels configured, the chart shows the No risk levels configured yet message. To add risk levels, select Set up. For more information, refer to Fraud Prevention Starter Kit.
Applicants breakdown
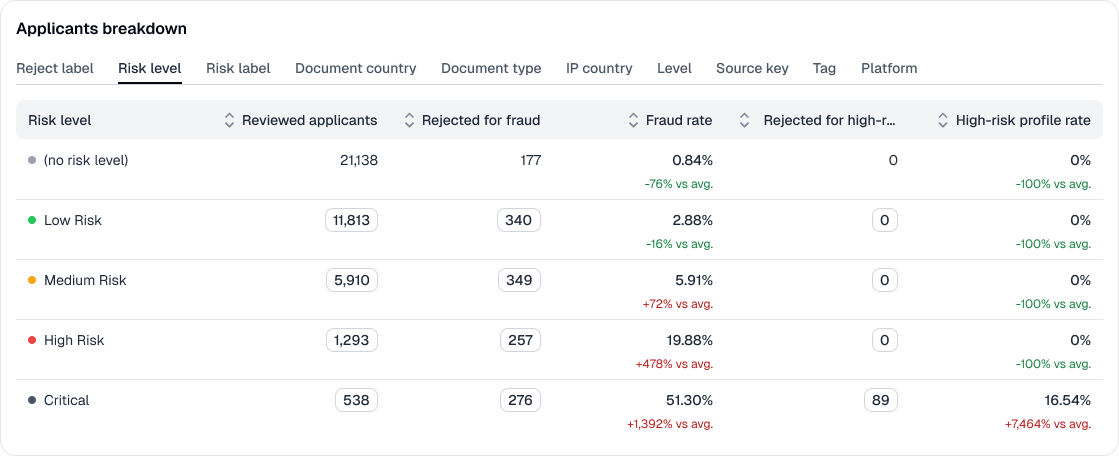
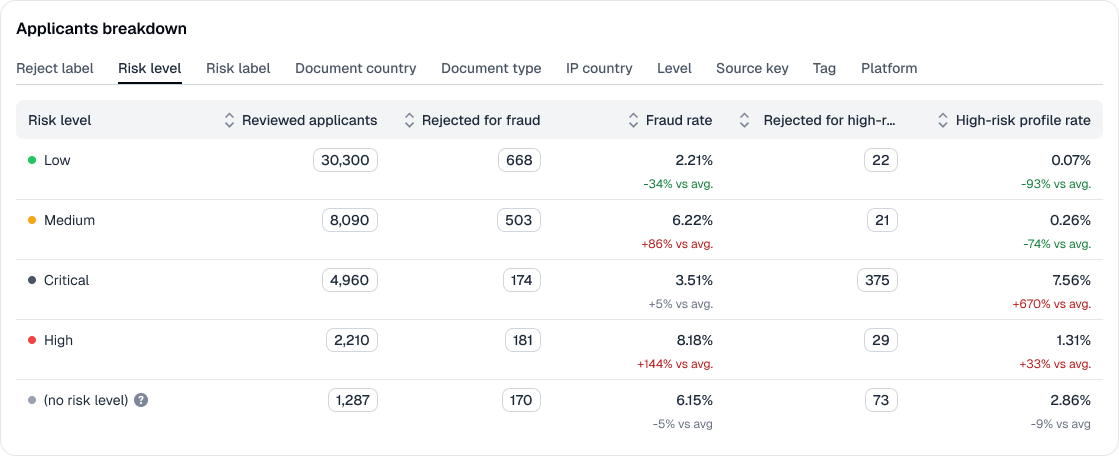
The Applicants breakdown table splits reviewed applicants into groups by one property at a time. Use it to find groups with more fraud than others. To select the property, open one of the following tabs:
- Reject label
- Risk level
- Risk label
- Document country
- Document type
- IP country
- Level
- Source key
- Tag
- Platform
For each group, the table shows Reviewed applicants, Rejected for fraud, Fraud rate, Rejected for high-risk profile, and High-risk profile rate.
- Share of total. Hover over a number of applicants to see its share of the corresponding total in the Reviewed applicants chart, with the same filters applied. For example, if the chart shows 200 applicants rejected for fraud and one country has 50, hovering over 50 shows 25% of applicants rejected for fraud.
- Difference from average. Below each rate, the table shows how much the group rate differs from the average. The average is the rate in the Reviewed applicants chart for all applicants matching your filters. For example, if the average Fraud rate is 2% and one country has 2.7%, the table shows +35% vs avg.
NoteWhen you change the filters, the rates in the Reviewed applicants chart change as well. The vs avg. values always compare against these rates.
Applicants examples
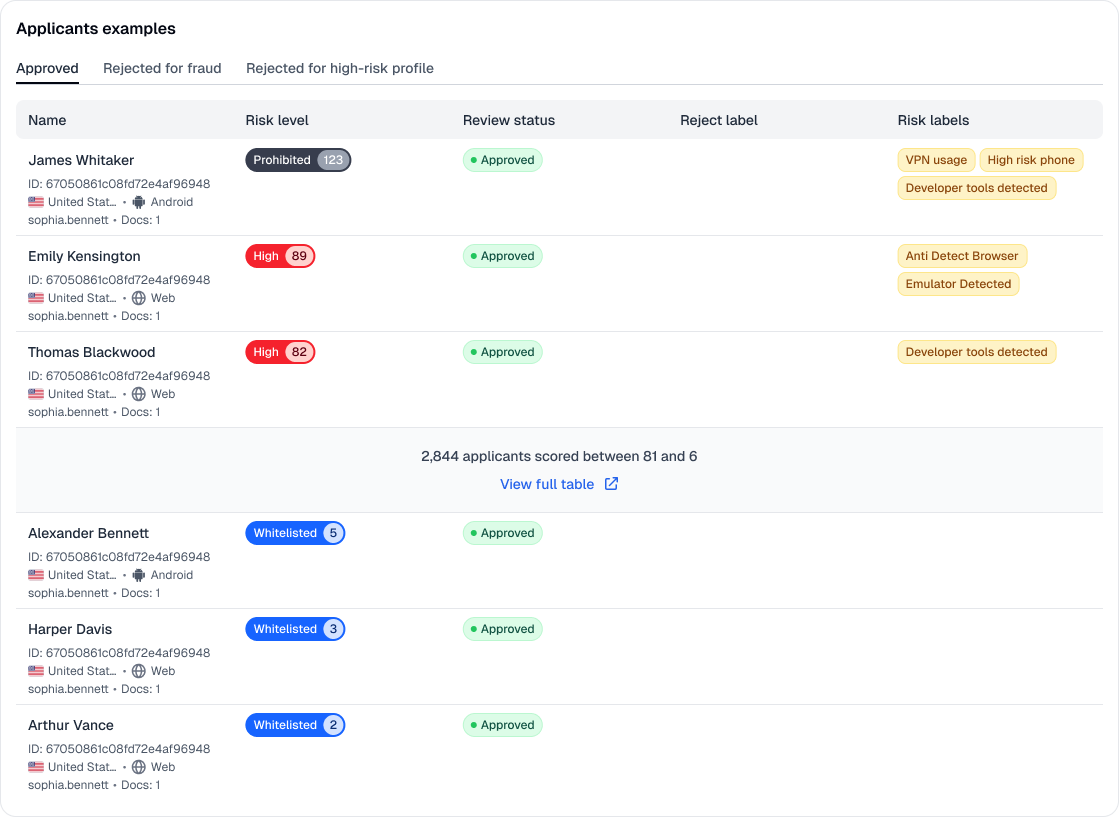
The Applicants examples section shows example applicants matching your current filters. Use it to review the decisions behind the numbers. Select one of the following tabs:
- Approved
- Rejected for fraud
- Rejected for high-risk profile
Each tab shows the applicants with the highest and the lowest risk scores. Compare the decision with the risk level of each applicant to interpret the results.
| Tab and risk level | Interpretation | Recommended action |
|---|---|---|
| Approved, high risk level | The most important group to review. These applicants can be fraud that your checks did not stop, or false positives: legitimate applicants that received a high risk level by mistake. | Review these applicants first. If they are fraudulent, start rejecting similar applicants with the High risk label or send them to manual review in Case Management. If they are legitimate, adjust your risk scoring rules so that similar applicants receive a lower risk level. |
| Approved, low risk level | Expected result. These are typical low-risk users. | No action required. |
| Rejected for fraud, high risk level | Expected result. The risk level matches the fraud confirmed by your team. | No action required. |
| Rejected for fraud, low risk level | Your risk signals can miss some fraud. These applicants are often opportunistic fraudsters: people who use their real contact data, do not commit fraud at scale, and attempted it only once. | Look for common traits among these applicants. Add rules or adjust your risk scoring rules so that similar applicants receive a higher risk level. |
| Rejected for high-risk profile | Your team rejected these applicants under your risk policy because their risk of committing fraud is too high. The tab shows examples with the lowest and the highest risk scores in this group. | Confirm that the lowest-score examples are too risky for your business. If they are not, change the risk level at which you reject applicants. |
If you have no risk levels configured, this section shows the newest and the oldest applicants, together with a message on how to add risk levels.
Largest applicants networks examples
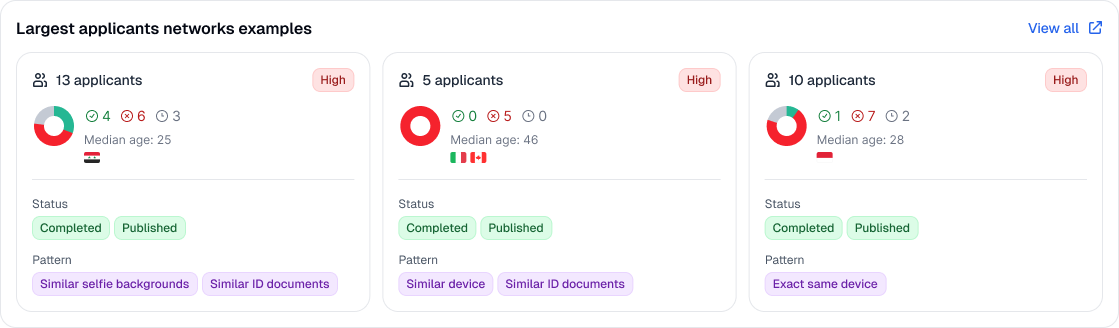
The Largest applicants networks examples section shows the largest fraud networks that include applicants matching your current filters.
A fraud network is a group of applicants connected by the same data, for example, the same device. Each card shows the number of applicants, the network ID, the network status, and the pattern detected by Sumsub.
To open a network, select its card. To see all networks, select View all.
Investigate fraud increase
To go from a number on a chart to the applicants behind it:
- Find the increase. In Reviewed applicants, look for a sudden increase in the Fraud rate or High-risk profile rate. Set the Created filter to the days around the increase.
- Find the group. In Applicants breakdown, open the tabs one by one and sort by Fraud rate. Look for groups with a high rate and a red vs avg. value, for example, a single country, source key, or platform.
- Filter by the group. Add the group as a filter. All page sections now show only this group.
- Review the applicants. In Applicants examples, review the applicants with the highest risk scores, especially on the Approved tab. To see all applicants, select View full table, or select a number in the breakdown table.
- Check for connections. In Largest applicants networks examples, check whether these applicants are connected through fraud networks.
After you identify the cause, use other Sumsub tools to address it:
- Adjust your applicant risk scoring rules so that these applicants receive a higher risk level.
- In Workflow Automation, route these applicants to additional checks or to manual review.
- Add confirmed fraudsters to the blocklist. This helps Sumsub detect connected applicants in the future.
Validate risk levels
Before you use risk levels for automated decisions, make sure that they match confirmed fraud:
- In Applicants breakdown, open the Risk level tab.
- Compare the Fraud rate across levels. Higher risk levels must have a higher fraud rate than lower ones.
- In Applicants examples, open the Approved tab and review the approved applicants with the highest risk scores.
If higher risk levels do not have a higher fraud rate, or if many approved applicants have high risk levels, adjust your risk scoring rules. For more information, refer to this article.
Improve data accuracy
Fraud Radar shows only the data that Sumsub has. The more risk signals and confirmed fraud cases Sumsub receives, the more complete and accurate the page becomes.
Use Fraud Prevention Starter Kit
Fraud Prevention Starter Kit provides a full set of risk signals and a fraud risk level for each applicant, without building your own rules. With the Starter Kit, you get:
- Risk signals from email, phone, IP address, device, selfie, and connections between applicants.
- A risk level for each applicant, for example, Low, Medium, or High.
- The Risk levels chart, the Risk level tab and filter, and the Applicants examples section.
To add the Starter Kit, contact your Customer Success Manager at [email protected].
Report fraud detected outside Sumsub
You can detect fraud after verification, for example, from external reports, chargebacks, or user activity after onboarding. Report each of these applicants to Sumsub.
Each reported applicant makes your statistics more accurate:
- The Fraud rate and the breakdown table show the full amount of fraud, not only fraud detected during verification.
- You see which countries, documents, and platforms bring fraud that verification did not stop.
- Sumsub uses this information to detect connected applicants in the future and to assign more accurate risk levels.
Important
- Fraud Radar shows past results. It does not detect fraud or change your decisions.
- Fraud Radar covers individual applicants only. Company applicants (KYB) are not included.
- The numbers depend on your team’s decisions and rejection labels. If your team rarely uses fraud rejection labels, Fraud Radar shows less fraud than actually occurs.
Updated about 2 hours ago